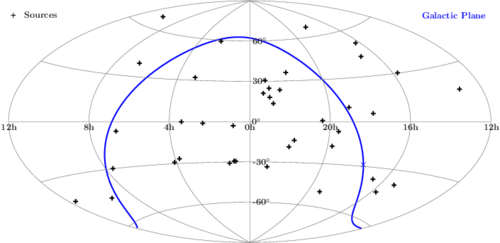
Skyplot of source positions (xfig example)
Jump to navigation
Jump to search
Skyplot of source positions
require("isisscripts");

xfig_new_color ("galactic_col", 0x0000FF);
xfig_new_color ("gridcol",      0x777777);

variable nr_src = 40;
variable src_positions = struct {
  ra  = urand(nr_src)*360,
  dec = asin(urand(nr_src)*2-1)/PI*180
};

variable N = 100; % #steps for axes
variable RA,DEC;

variable plot_width  = 24;
variable plot_height = 12;
variable p = xfig_plot_new(plot_width,plot_height);

p.world (-2,2,-1,1);
p.axis(;off);

variable ra_adjust  = 0.0;
variable dec_adjust = 0.6;

foreach RA ([-180:180:60])
{
  p.plot(Aitoff_projection ( Double_Type[N]+RA , [-90:90:#N]; deg, normalized) ; color="gridcol", width=1);
  p.xylabel(Aitoff_projection ( RA, 0 ; deg, normalized),sprintf("%dh",((360-RA)/15) mod 24), ra_adjust, dec_adjust);
}
ra_adjust  = -0.6;
dec_adjust = 0.0;
foreach DEC ([-60:60:30])
{
  p.plot(Aitoff_projection ( [-180:180:#N], Double_Type[N]+DEC ; deg, normalized) ; color="gridcol", width=1);
  p.xylabel(Aitoff_projection ( 0,  DEC ; deg, normalized),sprintf("%d$^\\circ$",DEC), ra_adjust, dec_adjust);
}

p.plot(Aitoff_projection (  -src_positions.ra,  src_positions.dec ; deg, normalized); sym = "+", fill = 20, size = 0.7, width=3);

p.plot(0.01,0.94; world0, sym = "+", fill = 20, size = 0.7);
p.xylabel(0.03,0.94,"Sources",-0.5,0; world0);

variable ra,dec,i;
variable galactic_col = "gal_plane";
(ra,dec) = RAdec_from_galLB ([0:360:#300],Double_Type[300]);
i = array_sort(pos_modulo(ra-180,360));
p.plot(Aitoff_projection (-ra[0],dec[0]; deg, normalized); color="galactic_col", depth=100, width=1, sym = "x");
ra = ra[i]; dec = dec[i];
p.plot(Aitoff_projection (-ra,dec; deg, normalized); color="galactic_col", depth=100, width=3);
p.xylabel(0.99,0.94,"Galactic Plane",0.5,0; world0,color =  "galactic_col");

p.render("source_skyplot.pdf");
