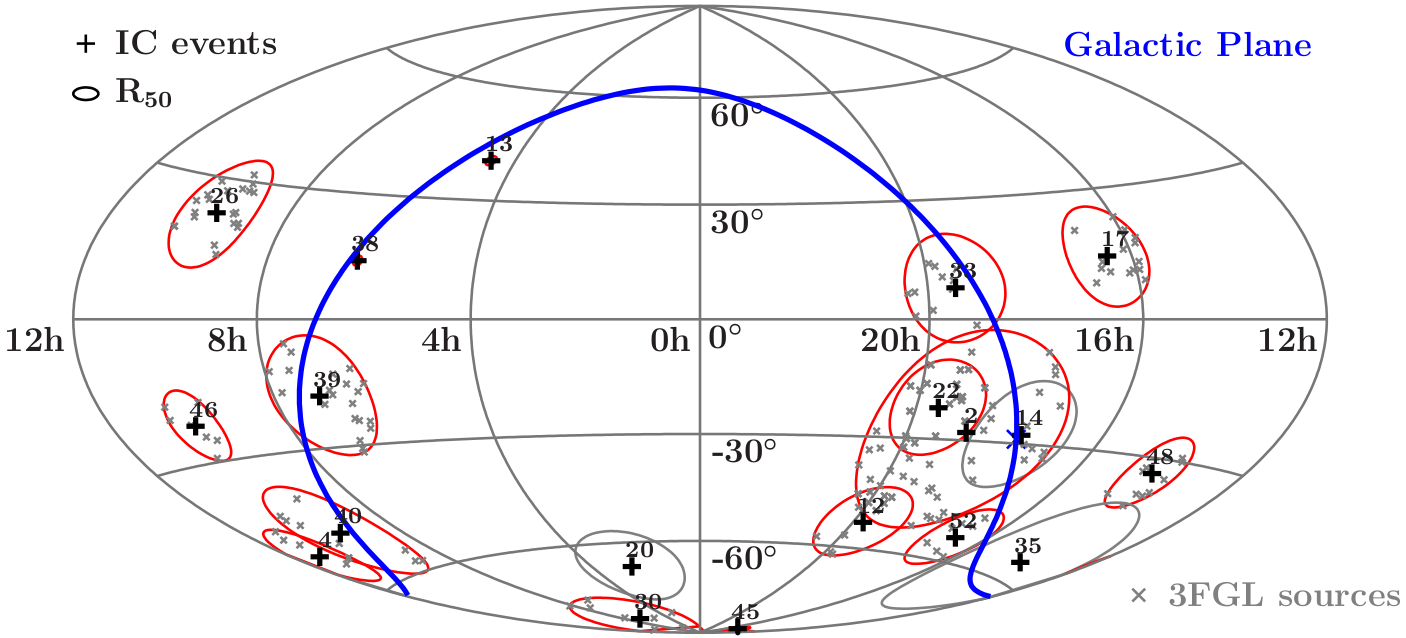
Plot skymap (xfig example)
Jump to navigation
Jump to search
require("isisscripts");

%runs in /home/krauss/scripts/neutrinos100tev
% see there for the files used below

%%%%%%%%%%%%%%%%%%%%%%%%%
% Read coordiates
variable abc = ascii_read_table("nuev.txt",[{"%s","id"},{"%F","e"},{"%F","ra"},{"%F","dec"},{"%F","angr"}]);


%%%%%%%%%%%%%%%%%%%%%%%%%
% Plot setup

xfig_new_color ("galactic_col", 0x0000FF);
xfig_new_color ("gridcol",      0x777777);
variable N = 300; % #steps for axes
variable plot_width  = 16;
variable plot_height = 8;
variable p = xfig_plot_new(plot_width,plot_height);
p.world (-2,2,-1,1);
p.axis(;off);


%%%%%%%%%%%%%%%%%%%%%%%%%
% GRID

variable RA, DEC;
variable ra_adjust  = 0.6;
variable dec_adjust = 0.6;

foreach RA ([-180:180:60])
{
  p.plot(Hammer_projection ( Double_Type[N]+RA , [-90:90:#N]; deg, normalized) ; color="gridcol", width=2);
  p.xylabel(Hammer_projection ( RA, 0 ; deg, normalized),sprintf("%dh",((360-RA)/15) mod 24), ra_adjust, dec_adjust);
}
ra_adjust  = -0.6;
dec_adjust = 0.6;
foreach DEC ([-60:60:30])
{
  p.plot(Hammer_projection ( [-180:180:#N], Double_Type[N]+DEC ; deg, normalized) ; color="gridcol", width=2);
  p.xylabel(Hammer_projection ( 0,  DEC ; deg, normalized),sprintf("%d$^\\circ$",DEC), ra_adjust, dec_adjust);
}

%%%%%%%%%%%%%%%%%%%%%%%%%
% EVENTS crosses

p.plot(Hammer_projection (  -abc.ra,  abc.dec ; deg, normalized); sym = "+", fill = 20, size = 0.7, width=3);

variable i;
_for i(0, length(abc.dec)-1,1)
{
    p.xylabel(Hammer_projection (  -abc.ra[i],  abc.dec[i] ; deg, normalized), "\scriptsize "R+abc.id[i],-0.2,-0.8;depth=1);
}


p.plot(0.01,0.94; world0, sym = "+", fill = 20, size = 0.7);
p.xylabel(0.03,0.94,"IC events",-0.5,0; world0);

variable R=0.01;
variable tmp = [0:2*PI:#100];

p.plot((R*cos(tmp))+0.01, R*sin(tmp)+0.86;world00,line=0, color="black" );
p.xylabel(0.03,0.86,"R$_{50}$"R,-0.5,0; world0);


%%%%%%%%%%%%%%%%%%%%%%%%%
% Galactic plane

variable ra,dec,i;
variable galactic_col = "gal_plane";
(ra,dec) = RAdec_from_galLB ([0:360:#300],Double_Type[300]);
i = array_sort(pos_modulo(ra-180,360));
p.plot(Hammer_projection (-ra[0],dec[0]; deg, normalized); color="galactic_col", depth=100, width=2, sym = "x");
ra = ra[i]; dec = dec[i];
p.plot(Hammer_projection (-ra,dec; deg, normalized); color="galactic_col", depth=10, width=3);
p.xylabel(0.99,0.94,"Galactic Plane",0.5,0; world0,color =  "galactic_col");


p.plot(0.85,0.06; world0, sym = "x", color="gray", size = 0.7);
p.xylabel(0.87,0.06,"3FGL sources",-0.5,0; world0, color="gray");


%%%%%%%%%%%%%%%%%%%%%%%%%
% Circles

variable R; %angular resolution
define get_circle (R,ra,dec)
{
    ra = ra*PI/180;
    dec = dec*PI/180+PI/2;
    R = R* PI/180;

    %print(ra);
    %print(dec);
    variable tmp = [0:2*PI:#100];

    variable x = (sin(R)*cos(ra)*cos(dec)*cos(tmp)) -
    (sin(R)*sin(ra)*sin(tmp)) + (cos(R)*sin(dec)*cos(ra));

    variable y = (sin(R)*sin(ra)*cos(dec)*cos(tmp)) +
    (sin(R)*cos(ra)*sin(tmp)) + (cos(R)*sin(dec)*sin(ra));

    variable z = -sin(R)*sin(dec)*cos(tmp)+cos(R)*cos(dec);

    variable decnew = acos(z);
    variable ranew = atan2(y,x);
    %print(max(ranew));
    %print(max(decnew));
    return ranew*180/PI, (decnew-PI/2)*180/PI;
}


variable j;

_for i (0, length(abc.angr)-1,1)
{

    R=abc.angr[i];
    variable ranew,decnew;
    (ranew,decnew) = get_circle (R,abc.ra[i],abc.dec[i]);

    %print(R);

    variable indexbreak=0;
    variable breakflag=0;
    variable prevval = Double_Type[0];
    variable breakval = Double_Type[0];


    if (i==1)
    {
	%print(ranew);
    }
    _for j (0, length(ranew)-2,1)
    {


	if (abs(ranew[j]-ranew[j+1]) > 10)
	{

	    prevval = [prevval,ranew[j]];
	    breakval = [breakval,ranew[j+1]];
	    indexbreak=[indexbreak,j+1];
	    breakflag=1;
	}


    }


    if (breakflag == 1)
    {


	variable xnew = struct {ra = ranew, dec=decnew };

	variable xnew1 = struct_filter(xnew,where(xnew.ra <= 0);copy);
	variable xnew2 = struct_filter(xnew,where(xnew.ra >= 0);copy);


	if (abc.e[i]>1000)
	{
	    p.plot(Hammer_projection(-(xnew1.ra),xnew1.dec;deg, normalized) ;
	    line=0, color="gray" );
	    p.plot(Hammer_projection(-(xnew2.ra),xnew2.dec;deg, normalized) ;
	    line=0, color="gray" );
	}
	else
	{
	    p.plot(Hammer_projection(-xnew1.ra,xnew1.dec;deg, normalized) ;
	    line=0, color="red" );

	    p.plot(Hammer_projection(-xnew2.ra,xnew2.dec;deg, normalized) ;
	    line=0, color="red" );
	}
    }
    else
    {
	if (abc.e[i]>1000)
	{
	    p.plot(Hammer_projection(-(ranew),decnew;deg, normalized) ;
	    line=0, color="gray" );
	}
	else
	{
	    p.plot(Hammer_projection(-ranew,decnew;deg, normalized) ;
	    line=0, color="red" );
	}
}

}


%%%%%%%%%%%%%%%%%%%%%%%%%%%%%%%%%%%
% 3FGL SRC
require("/home/krauss/scripts/neutrinos100tev/read3fgl.sl");
variable effpath = "/home/krauss/important_data/neutrinos_2015_12/";

variable event = [2,4,12,13,17,22,26,30,33,38,39,40,45,46,48,52];
variable j;
_for i (0, length(event)-1,1)
{

    variable b = ascii_read_table (effpath+"eventsummary2.txt",[{"%u","id"},{"%f","energy"},{"%s","b1"},{"%f","energyerr1"},{"%f","energyerr2"},{"%s","b2"},{"%s","time"},{"%f","dec"},{"%f","ra"},{"%s","ang"},{"%s","top"}]);

    struct_filter(b, where(b.id == event[i]));

    if (length(b.ra) > 1 || length(b.ra) == 0)
    {
	vmessage("Something went wrong, no or multiple events found!");
    }

    if (b.ang[0] == "<1.4")
    {
	variable ang = 1.4;
    }
    else
    {
	ang = atof(b.ang[0]);
    }

    variable all_src, evt;

    (evt, all_src) = get_fgl (b.id[0], b.ra[0], b.dec[0], ang);

    _for j(0, length(all_src.src)-1,1)
    {

	variable ratem = strchop(all_src.ra[j],' ',0);
	variable dectem = strchop(all_src.dec[j],' ',0);

	variable ranew = hr2ra(atof(ratem[1]),atof(ratem[2]),atof(ratem[3]));
	variable decnew = hr2dec(atof(dectem[1]),atof(dectem[2]),atof(dectem[3]));


	p.plot(Hammer_projection(-ranew,decnew;deg,normalized);color="gray",sym="x",size=0.35);

    }

}

%%%%%%%%%%%%%
% Render
p.render("source_skyplot.pdf");
