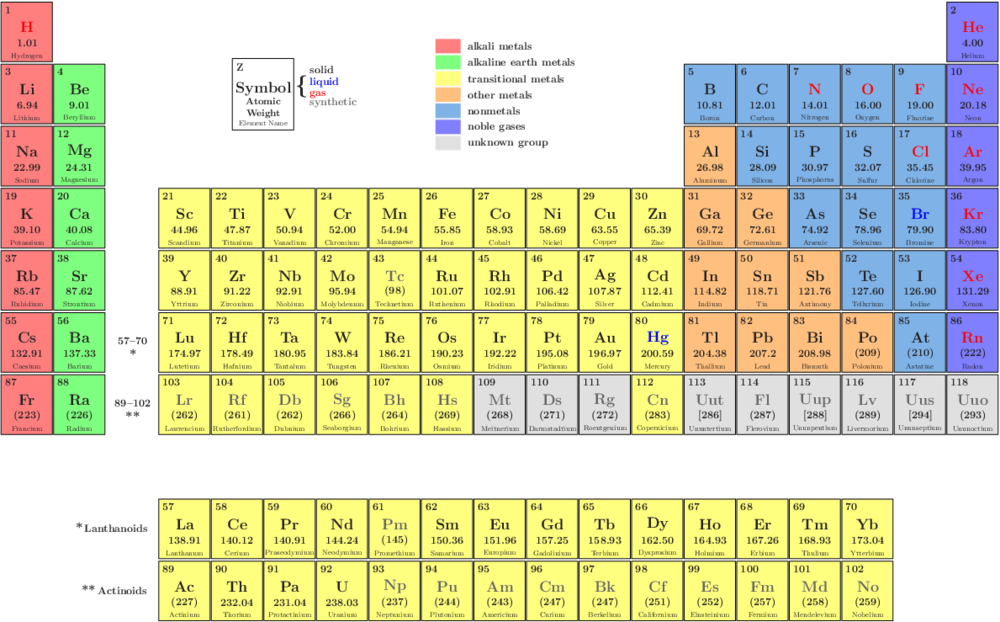
Periodic Table of the Elements (xfig example)
Jump to navigation
Jump to search
Peridodic Table of the Elements
This script loads a datafile (ptdata.sl) with the symbols, names, and other properties in form of an array of lists. The array is built such that the index of an entry equals the proton number //Z//. Some of the properties (e.g., groups like metals / nonmetals, state, ...) are used as names for color definitions.
The data file format is as:
variable elements = [{"Symbol","Element Name","\centering \small Atomic\\Weight"R,"black","white"},
{"H",   "Hydrogen",      "1.01"  ,"gas", "alkali"},
{"He",  "Helium",        "4.00"  ,"gas", "noblegas"},
...
];
Additionally, the code is written in a way that allows to easily switch between color and black/white versions of the table via a simple integer variable incolor, which triggers different color definitions.
require("isisscripts");

% periodic table entries:
require("ptdata.sl");
%-> variable elements

variable incolor = 1;
if(incolor){
   xfig_new_color("solid" , rgb2hex(0.  , 0.  , 0.   ) );
   xfig_new_color("liquid" , rgb2hex(0.  , 0.  , 1.   ) );
   xfig_new_color("gas" , rgb2hex(1.  , 0.  , 0.   ) );
   xfig_new_color("synthetic" , rgb2hex(0.4  , 0.4  , 0.4   ) );
   xfig_new_color("alkali" , rgb2hex(1.  , 0.  , 0.   ) );
   xfig_new_color("alkaline" , rgb2hex(0.  , 1.  , 0.   ) );
   xfig_new_color("transmetal" , rgb2hex(1.  , 1.  , 0.   ) );
   xfig_new_color("metal" , rgb2hex(1.  , 0.5  , 0.   ) );
   xfig_new_color("nonmetal" , rgb2hex(0.  , .4  , 0.8   ) );
   xfig_new_color("noblegas" , rgb2hex(0.  , 0.  , 1.   ) );
   xfig_new_color("unknown" , rgb2hex(0.75  , 0.75  , .75   ) );
}else{
   xfig_new_color("solid" , rgb2hex(0.  , 0.  , 0.   ) );
   xfig_new_color("liquid" , rgb2hex(0.  , 0.  , 0.   ) );
   xfig_new_color("gas" , rgb2hex(0.  , 0.  , 0.   ) );
   xfig_new_color("synthetic" , rgb2hex(0.  , 0.  , 0.   ) );
   xfig_new_color("alkali" , rgb2hex(1.  , 1.  , 1.   ) );
   xfig_new_color("alkaline" , rgb2hex(1.  , 1.  , 1.   ) );
   xfig_new_color("transmetal" , rgb2hex(1.  , 1.  , 1.   ) );
   xfig_new_color("metal" , rgb2hex(1.  , 1.  , 1.   ) );
   xfig_new_color("nonmetal" , rgb2hex(1.  , 1.  , 1.   ) );
   xfig_new_color("noblegas" , rgb2hex(1.  , 1.  , 1.   ) );
   xfig_new_color("unknown" , rgb2hex(1.  , 1.  , 1.   ) );
}

% a map for the positions of the individual elements (Z) in the periodic table
variable rows = {
   [1,0*ones(17),2],
   [3,4,0*ones(11),[5:10]],
   [11,12,0*ones(11),[13:18]],
   [19,20,0,[21:36]],
   [37,38,0,[39:54]],
   [55,56,0,[71:86]],
   [87,88,0,[103:118]],
   [57:70],
   [89:102]
};

% the dimensions for the cells of the table
variable wcell = 2.15;
variable hcell = 2.5;

define cell(Z){
   variable xc = xfig_plot_new(wcell,hcell);
   xc.world(0,wcell,0,hcell);
   xc.axes(;off);
   xc.plot([0,0,wcell,wcell,0],[0,hcell,hcell,0,0];depth=15);
   variable bg = xfig_new_polyline([0,0,wcell,wcell],[0,hcell,hcell,0];
			  closed,areafill=30,fillcolor=elements[Z][4],color="white");
   xc.add_object(bg,0,0,-0.5,-0.5;depth=50);
   xc.xylabel(0.5*wcell,0.1*hcell, sprintf("\usefont{T1}{arial}{b}{n}\scriptsize %s"R,elements[Z][1]),0,0;depth=10);
   xc.xylabel(0.5*wcell,0.58*hcell, elements[Z][0] ,0,0; size="\Large"R, color=elements[Z][3],depth=10);
   if(Z==0){
      xc.xylabel(0.05*wcell,0.87*hcell, "Z" ,-0.5,0 ;depth=10);
   }else{
      xc.xylabel(0.05*wcell,0.87*hcell, "$Z"$ ,-0.5,0 ;depth=10);
   }
   xc.xylabel(0.5*wcell,0.31*hcell, elements[Z][2] ,0,0 ;depth=10);
   return xc;
}

variable pl = xfig_plot_new(19*wcell,10*hcell);
pl.world(1,19*wcell,10*hcell,1);
pl.axes(;off);

variable ii, rr,cc;
_for ii(1,7,1){
   cc=1;
   foreach rr (rows[ii-1]){
      if(rr==0){ cc++; continue; }
      pl.add_object(cell(rr), cc*wcell, ii*hcell, -0.5,-0.5);
      cc++;
   }
}

_for ii(8,9,1){
   cc=4;
   foreach rr (rows[ii-1]){
      pl.add_object(cell(rr), cc*wcell, (ii+1)*hcell, -0.5,-0.5);
      cc++;
   }
}

pl.xylabel(3.5*wcell,5.5*hcell,"57--70"R,0,0);
pl.xylabel(3.5*wcell,5.7*hcell,"\large *"R,0,0);
pl.xylabel(3.5*wcell,6.5*hcell,"89--102"R,0,0);
pl.xylabel(3.5*wcell,6.7*hcell,"\large **"R,0,0);

pl.xylabel(3.8*wcell,8.5*hcell,"{\large *}\,Lanthanoids"R,0.5,0);
pl.xylabel(3.8*wcell,9.5*hcell,"{\large **}\,Actinoids"R,0.5,0);

% cell description:
variable sc = 1.2;
wcell *=sc; hcell *=sc;
pl.add_object(cell(0),5.4*wcell/sc,2.1*hcell/sc,-0.5,-0.5);
wcell /=sc; hcell /=sc;

if(incolor){
   pl.xylabel((5.35+sc)*wcell,1.4*hcell, "\Huge\{"R,-0.5,0);
   pl.xylabel((5.65+sc)*wcell,1.125*hcell, "solid", -0.5,0;color="solid");
   pl.xylabel((5.65+sc)*wcell,1.325*hcell, "liquid", -0.5,0;color="liquid");
   pl.xylabel((5.65+sc)*wcell,1.525*hcell, "gas", -0.5,0;color="gas");
   pl.xylabel((5.65+sc)*wcell,1.65*hcell, "synthetic", -0.5,0;color="synthetic");

   variable desc = ["alkali metals", "alkaline earth metals", "transitional metals",
		    "other metals", "nonmetals", "noble gases", "unknown group"];
   variable cl = ["alkali","alkaline","transmetal","metal","nonmetal",
		  "noblegas","unknown"];
   variable bx;

   _for ii(0,6,1){
      bx = xfig_new_polyline([0,0,wcell/2.,wcell/2.],[0,hcell/4.,hcell/4.,0];
		    closed,areafill=30,fillcolor=cl[ii],color="white");
      pl.add_object(bx,9.75*wcell,(0.75+ii*0.26)*hcell,0.5,0;depth=50);
      pl.xylabel(9.85*wcell,(0.75+ii*0.26)*hcell,desc[ii],-0.5,0);
   }

}

pl.render("pt.pdf");
