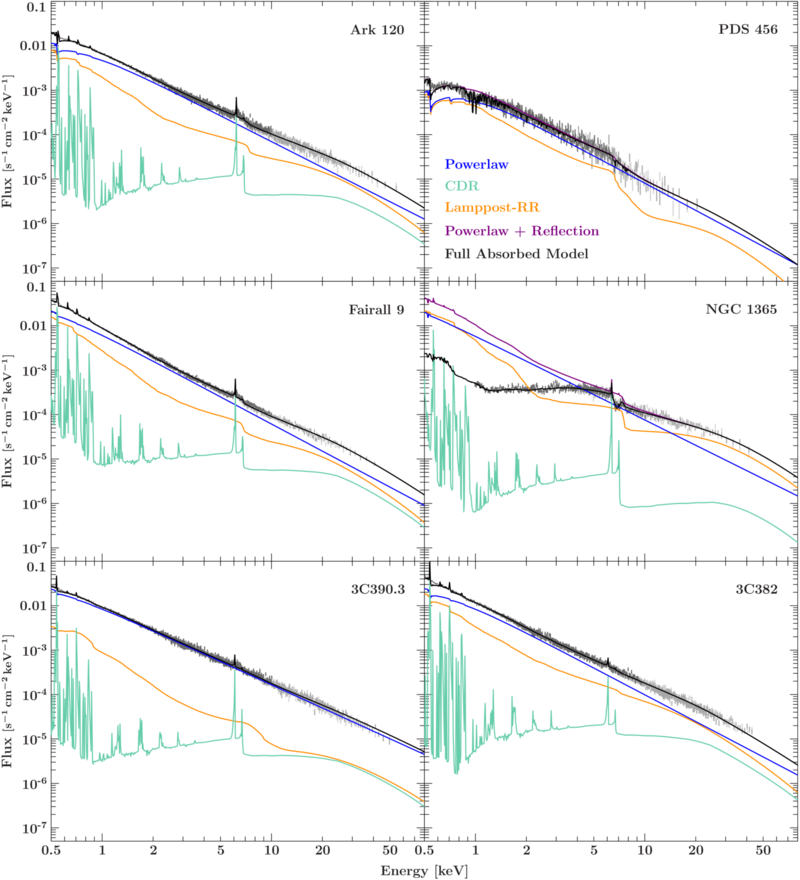
Model decomp (xfig example)
Jump to navigation
Jump to search
Spectral data and models of the best fits have been stored in tables using write_plot() and eval_fun_keV() in a file structure of shape /userdata/data/user/ "source" / "model" /decomposition/ "component"
#!/usr/bin/env isis-script

require("isisscripts");

variable COLOR = ["dimgray","darkgray","lightgrey"];
variable MCOLOR = ["darkorange","blue","mediumaquamarine","purple","black"];

% Lists of object names and model components to automatically build data paths
variable comp_list = {"tbnew_feo*relxilllp","tbnew_feo*powerlaw","tbnew_feo*xillver","complete_model","absorbed_model"};
variable namelist = {"ark120","pds456","fairall9", "ngc1365", "3c390_3", "3c382"};
variable tex_name = {"Ark 120","PDS 456","Fairall 9", "NGC 1365", "3C390.3", "3C382"};
variable detconst = {{1,1/1.08,1/1.1},{1,1/0.68,1/0.75},{1,1/0.995,1/1.02},{1,1/0.96,1/0.98},{1,1/1.062567,1/1.115621},{1,1/0.8153,1/0.7853389}};

%-------main-loop-over-namelist---------------
variable panel = Struct_Type[length(namelist)];
variable i,j, lo, hi, val, err, err_max, err_min;

for(j=0;j<length(namelist);j++){

	% initialize panel j
	panel[j] = xfig_plot_new(12, 9);
	panel[j].world(0.5,80,5e-08,0.1; xlog=1, ylog=1);
	panel[j].ylabel(`Flux \footnotesize[s$^{-1}$\,cm$^{-2}$\,keV$^{-1}$]`);
	panel[j].xylabel(0.95,0.9,tex_name[j],0.5,0; world0);

	variable write_folder = "/userdata/data/fink/"+namelist[j]+"/fit_relxilllp/decomposition/";

	% plot data from three detectors in the background, corrected for according detector constant
	for(i=0;i<=2;i++){
		(lo, hi, val, err) = readcol(write_folder+"data_"+string(i)+".dat", 1, 2, 3, 4);
		panel[j].plot((lo+hi)/2., val*detconst[j][i], err*detconst[j][i]; sym="point", size=-1, eb_factor=0, color=COLOR[i]);
	}

	% plot model components (exception for pds456)
	for(i=0;i<length(comp_list);i++){
		if(not(comp_list[i]=="tbnew_feo*xillver" && namelist[j] == "pds456")){
		(lo, hi, val) = readcol(write_folder+comp_list[i]+".dat", 1, 2, 3);
		panel[j].plot((lo+hi)/2, val; line=0, eb_factor=0, size=0.01, color=MCOLOR[i], depth=10-i);
		}
	}
}

% some model labels
variable ypos = 0.42, ystep = 0.08;
panel[1].xylabel(0.05, ypos - 0*ystep, "Powerlaw", -0.5, 0; world0, color = MCOLOR[1]);
panel[1].xylabel(0.05, ypos - 1*ystep, "CDR",-0.5,0; world0, color = MCOLOR[2]);
panel[1].xylabel(0.05, ypos - 2*ystep, "Lamppost-RR",-0.5,0; world0, color = MCOLOR[0]);
panel[1].xylabel(0.05, ypos - 3*ystep, "Powerlaw + Reflection",-0.5,0; world0, color = MCOLOR[3]);
panel[1].xylabel(0.05, ypos - 4*ystep, "Full Absorbed Model",-0.5,0; world0, color = MCOLOR[4]);

%---------render-all--------------
variable multi = xfig_multiplot(panel; xlabel=`Energy [keV]`, cols=2);
multi.render("multipanel_decomposition.pdf");

quit;
