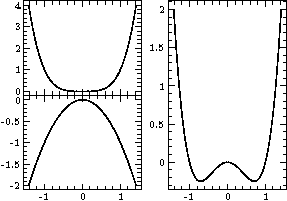
Compounds and multi-panel plots (xfig example)
an example added by Manfred
Compounds
A 'compound' is a collection of several Xfig objects (of any type) that are grouped together, i.e., they can be rendered at once and be transformed – e.g., translated, scaled, and maybe rotated – together.
The function xfig_new_compound creates such a 'compound' as an SLxfig object, see
help("xfig_new_compound");
Note that xfig_new_compound assumes that the member objects are already aligned with respect to each other.
In contrast, the functions xfig_new_hbox_compound and xfig_new_vbox_compound
translate the objects (which are given as arguments to these functions) in horizontal, respectively vertical direction
such that those become aligned next to, respectively on top of each other.
Additional spacing can be specified as an optional last argument.
While xfig_multiplot can take an array of plots like xfig_multiplot([pl1,pl2,pl3]), xfig_new_*compound needs each plot to be an individual argument: xfig_new_*compound(pl1,pl2,pl3). The use of _ _push_array (available through the isisscripts) helps to circumvent this issue:
require("isisscripts");
...
variable plotlist = [pl1,pl2,pl3];
...
xfig_new_hbox_compound(__array_push(plotlist));
Multi-panel plots
The function xfig_multiplot combines several plot objects
(which are themselves compounds of many low-level objects, such as lines and images)
into a compound object, and additionally removes those labels and ticlabels
that are superfluous if more plots share the same axes.
However, the user must ensure him/herself that the plots which are to be combined in a multiplot,
have all the same respective axes!
Example
 variable W=5, H=4,  % width & height;  all plots will use these sizes
          x=[-sqrt(2):sqrt(2):#101];  % and these values on the x-axis

 variable pl11=xfig_plot_new(W, H);
          pl11.plot(x,x^4);

 variable pl12=xfig_plot_new(W, H);
          pl12.plot(x, -x^2);

 variable pl2=xfig_plot_new(W, 2*H);  % twice as high
          pl2.plot(x, x^4-x^2);

 % combine plots pl11 and pl12 to a mulitplot
 variable mp1 = xfig_multiplot(pl11, pl12);

 % combine the multiplot mp1 and the plot pl2 horizontally next to each other
 variable comp = xfig_new_hbox_compound(mp1, pl2, 0.3);
          comp.render("multiplot_and_plot.eps");
If mp1 and comp are not needed for anything else, the latter three commands could also have been combined into a single one:
 xfig_new_hbox_compound( xfig_multiplot(pl11, pl12),
                         pl2,
                         0.3
                       ).render("multiplot_and_plot.eps");
Note that for the creation of the above image, I took advantage of comp being a compound, and resized all objects together:
 comb.scale(0.75);
 comp.render("multiplot_and_plot.png");
