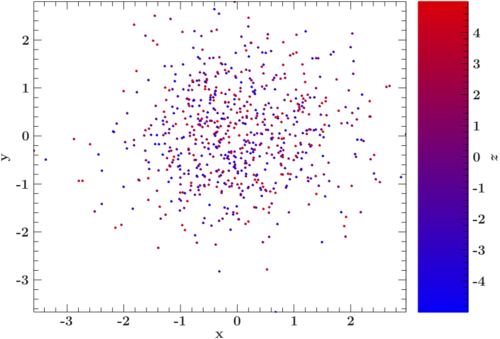
Colorcoded scatter plot
Jump to navigation
Jump to search
PDF-version: File:My very cool colorcode.pdf
require("isisscripts");
_traceback = 1;

%generate data
variable datapoint_number = 700;
variable x = grand( datapoint_number );
variable y = grand( datapoint_number );
variable z = urand( datapoint_number ) * 10. - 5.;
variable z_min = min( z );
variable z_max = max( z );

%generate colors for colorbar
variable bin_number = 256;
variable low_color = "blue";
variable hig_color = "red";
variable colornames = String_Type[bin_number];
variable jj , lo , hi;
( lo , hi ) = linear_grid( z_min , z_max , bin_number );
_for jj( 0 , bin_number - 1 , 1 ) {
    variable binmid = ( hi[jj] + lo[jj] ) / 2 ;
    variable frac_value = ( ( binmid - z_min ) / ( z_max - z_min ) );
    colornames[jj] = xfig_mix_colors( hig_color , low_color , frac_value );
                                  }

%scatter plot
variable p1 = xfig_plot_new( 12 , 10 );
p1.world( min(x) , max(x), min(y), max(y) );
p1.xlabel( "x" );
p1.ylabel( "y" );
_for jj( 0 , datapoint_number - 1 , 1 ){
    variable curentz = z[jj];
    variable curpos = where( curentz >= lo )[-1];
    p1.plot( x[jj] , y[jj] ; sym = "point" , color = colornames[curpos] );
                                       }

%colorbar plot
variable p2 = xfig_plot_new( 2 , 10 );
p2.world( 0 , 1 , z_min , z_max );
p2.xaxis( ; off );
p2.yaxis( ; off );
p2.y2axis( ; on );
p2.y2label( "$z$"R );
p2.y1axis( ; major_color = "white" , minor_color = "white" );
_for jj( 0 , bin_number - 1 , 1 ){
    p2.shade_region( 0.2 , 1. , lo[jj] , hi[jj] ; color = colornames[jj] );
                                 }

%combine plots
variable p = xfig_multiplot( p1 , p2 ; cols = 2 );
p.render( "my_very_cool_colorcode.pdf" );

exit();
