4U 1700+24
Also known as: V*V934 Her, 2A 1704+241, 3A 1703+241, IRAS 17044+2402, SWIFT J1706.7+2401 Simbad
Monitoring data: ASM, BAT, MAXI
Coordinates
RA 17h 06m 34.5183s, DEC +23° 58' 18.554" Simbad
Binary System
Distance of 730 pc
Orbit
~400days ([1])
Optical companion
Red star, HD 154791 ([1])
V ~ 7.8 ([1])
Spectral type: M3 II Simbad
Available data
- RXTE: 28ksec ToO (Aug, Sep 2002), 14ksec pointing (Feb 1997), 8ksec ToO (Nov 1997)
- Chandra: HRC-I 1ksec image (Apr 2005), 3ksec 13" off-axis ACIS-I observation (Dec 2002)
- ASCA: 25ksec pointing (Mar 1995)
- XMM Newton: 3x12ksec pointing (Apr and Aug 2003), 12ksec pointing (Aug 2002)
- Swift: 10ksec XRT observation (__Jun 2010!__)
- Suzaku: 50ksec observation (Aug 2007)
- BeppoSAX: 20ksec
Description
4U 1700+24 was observed for the first time with the satellite Ariel V. At the time, it was not considered an X-ray binary, but a variable star ([2]). This system shows dramatic luminosity variations. The rapid (10–1000 s) time variability in X–rays observed with Einstein and EXOSAT spacecraft is strongly suggestive of turbulent accretion, often observed in X– ray binaries. The hardness of the spectrum suggests an origin from accretion onto a compact object, but it cannot be used as a decisive parameter ([1])
Flux/Luminosity
∼2×10⁻¹⁰ erg cm−2 s−1 assuming a Comptonization spectrum as described in [1] for the BeppoSAX data.
X–ray luminosity: LX ∼1033 erg s−1. ([1])
Spectrum
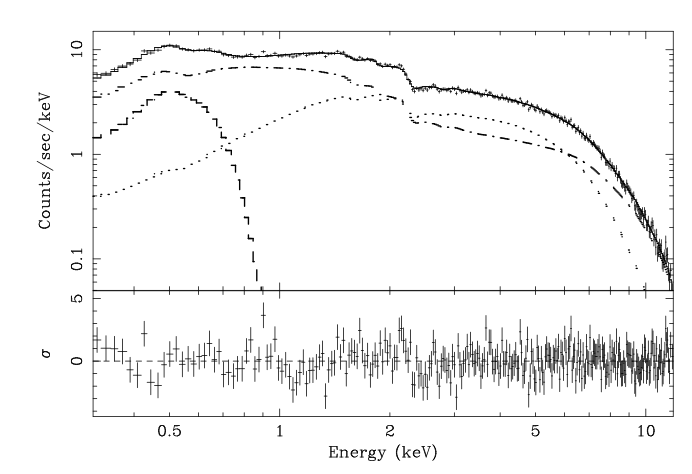
Usually modeled by a blackbody + Comptonization
Figure 1: “The PN (instrument on board the XMM-Newton Telescope) count rate spectrum of 4U 1700+24 , and residuals (in units of σ) with respect to the best-fit model described in Table 1. The individual model components are also shown: dashed line for the broad Gaussian, dot- ted line for the blackbody and dash-dotted line for the Comptonization model.” ([3])
Light Curve
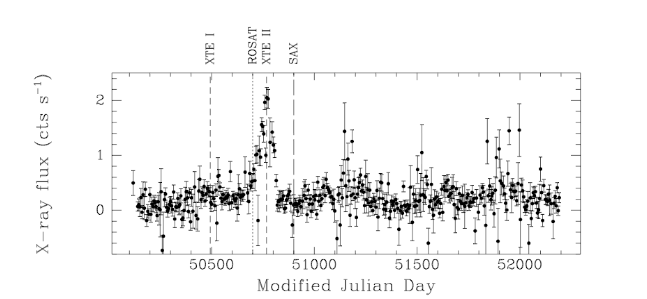
Figure 2. RXTE observations/Light curve of 4U 1700+24. 1 ASM count s−1 obtained from [1]. In the plot the times of the pointed RXTE, ROSAT and BeppoSAX are indicated by the vertical dashed lines (different dashes correspond to different spacecraft).

