Suzaku
Suzaku Data Extraction
Suzaku consists of four detectors:
- four XISs (X-ray Imaging Spectrometer, 0-3), useable energy range 1-9 keV
- PIN, useable energy range 12-60 keV
- GSO, useable energy range 57-300 keV
- XRS (X-ray Spectrometer), not useable since it failed after launch
PIN and GSO are mounted together within the HXD (Hard X-ray Detector). Unfortunately, XIS2 was hit by a micro meteorite in 2006 November and can no longer be used for analysis. A similar event happened to XIS0 in July 2009, but the damage is much less such that data is still useable. Also note that XIS1 is back illuminated, while the other ones are front illuminated (causing a difference in the background level).
You might visit the Suzaku News for Researches to stay up to date about the current status of the satellite and instruments. For a detailed description please have a look on the Suzaku Documents, where you can also find the Technical Description. The extraction scripts introduced below are written by Laura Barragan, Joern Wilms, Felix Fuerst, et al. and basically follow the Suzaku ABC Guide.
Until some calibrations problems around the Si- and Au-edges are solved, the useable energy range of the XIS has to be modified slightly. According to [(:biblio:Nowak11a)] the following energy ranges should be ignored for all XIS:
 ignore_en(xis_datasets, 1.72, 1.88);
 ignore_en(xis_datasets, 2.19, 2.37);
For the back-illuminated XIS1, [(:biblio:Kuehnel13a)] had to exclude the energy range between both edges (1.88-2.19 keV) as well to get a consistent description compared to XIS0 and XIS3.
Preparing the data
First, apply the newest calibration to the rawdata:
suzprepare --datadir path_to_raw_data --prepdir path_to_extraction --all
Thereby, datadir specifies the raw data directory, which you can find by, e.g., using the findobs script. The prepdir argument sets the extraction directory and the last one tells the script to prepare the data for all instruments listed above. Other parameters are xisN with the XIS number N (0-3), pin or gso. For example:
suzprepare --datadir /eu/X-ray/Suzaku/data/7/704063010 --predir `pwd`/ngc3783
In the extraction directory prepdir a subdirectory named reprocessed is created, where the event- and calibration-files are saved.
CALDB version
It is recommened to remember which version (which is a date-string) of the calibration database (CALDB) you've used for data preparation (you might want to add this information to your paper). You can use the following command to get the version installed at the date of calling this command:
find $CALDB/data/suzaku/*/caldb.indx -print -exec readlink {} \;
That will print out the filename (with the version included) for the HXD, XIS, XRT (X-ray telescopes focusing onto the XISs), and XRS. If you haven't wrote down the versions right when you've extracted the data, it is more complicated to find out which versions were used. In that case you can match the different versions available in
ls $CALDB/data/suzaku/*/index
against the creation date of your reprocessed-directory.
XIS
Correcting the Attitude
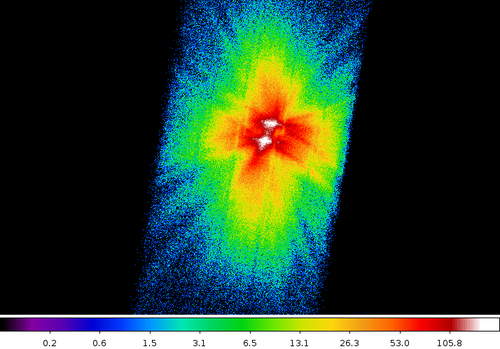
The Attitude of the satellite is not known precisely, which causes the XIS-images to show an "image crater" or even two images of the source (see picture on the right). Therefore, a script named aeattcor2 was developed to correct the satellites attitude by using an image of the source. This tool is already included in the xisextract extraction script.
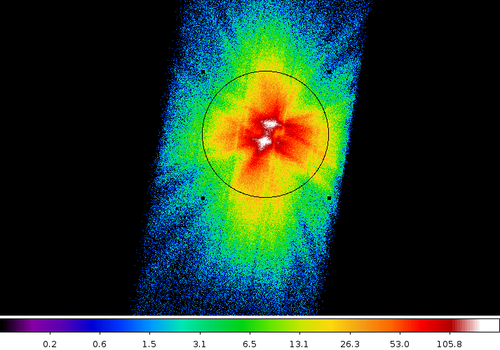
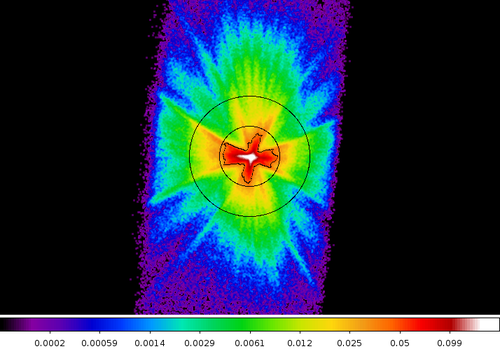
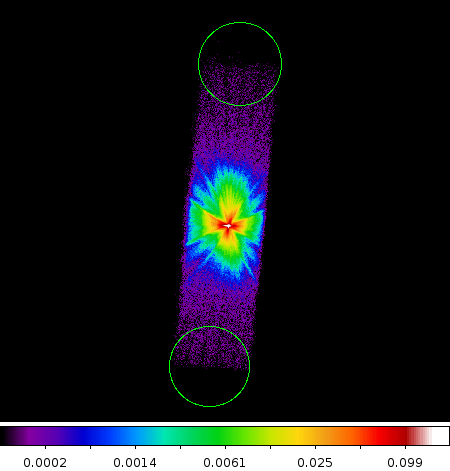
To correct the attitude using xisextract one needs to create a regionfile (by using, e.g., DS9) in WCS-coordinates containing a single and simple circle marking the source (see picture on the left). The radius of the circle should be around 90 arcsec. As an image, we open one of the cleaned event files ae{obsid}xi*_cl.evt located in the reprocessed directory. Furthermore, its worth to have a look on the unfiltered events *_uf.evt in case the filtered image looks weird. Here, we name the regionfile att_src.reg and save it in the prepdir directory.
Now, we call xisextract for the first time to use the region created before for correcting the attitude:
xisextract --prepdir ... --full --xis=N --attitude --srcreg=.../att_src.reg
Providing the --full option will cause xisextract to extract a full image of the source (without any spectra or lightcurves). This will create the subdirectory full or full.att (in case of corrrecting the attitude as described here) in the prepdir direcotry. The --xis option has to be set to the number of the XIS (0-3), which means one has to execute the above command for all XISs. If --attitude is given, the script calles aeattcor2 with the region file given with --srcreg. If successful, a folder called reprocessed.att will be created, which contains the corrected attitude and event files. If one looks on the *_sky.img images located within full.att, the image creater should be suppressed or the two sources should have merged. Note that depending on the level of the wrong attitude the result might not be fully satisfying.
Important note: in case the attitude correction fails the XISs were probably operated in the so-called burst mode. You can check the FITS header of the eventfiles to check on the clock mode (normal or burst):
fkeyprint reprocessed/ae{obsid}xi*_cl.evt CLK_MODE
The burst mode causes a huge number of GTIs, which aeattcor2 cannot handle. There is a workaround available which you can find below the next paragraph.
with aeattcor2 directly
For completeness and debugging purposes the attitude can be corrected directly using the aeattcor2 tool:
aeattcor2 attitude corrected_attitude events region
The old attitude file ae{obsid}.att (as created by suzprepare) can be found in the reprocessed directory. The tool has to be called for at least one event file (e.g., that of XIS3 in 3x3 readout mode) to get a corrected attitude file. The region has to be the same as described above.
Burst Mode
If the XISs were operated in burst mode, an articifial dead time during each frame is introduced to reduce pile-up (for more detail see the Technical Manual), which results in one GTI per frame. For instance given an observation with 40 ks total exposure time, operated in 1/4 window + 1 s burst option (exposure per frame is 2 s, from which 1 s is deadtime), the number of GTIs are around 40 ks / 2 s = 20000. That will cause aeattcor2 to crash.
Thus, in order to correct the attitude, we have to reduce the number of GTIs drastically. This can be achieved by using the --sloppygti option during the call of suzprepare:
suzprepare --datadir ... --prepdir ... --xis --sloppygti
Note, that we're providing the --xis options here. It's recommended to set the prepdir to another directory since the events during the deadtime are not supposed to account for a spectrum of lightcurve, of course.
Once the data are prepared, proceed with the attitude correction as described above. As soon as there are attitude files for each XIS and mode, copy them to your original prepdir directory. There, run xisextract to correct the attitude, but provide the attitude files you've just got using the sloppy GTIs:
xisextract --prepdir ... --full --xis=N --attitude --srcreg=.../att_src.reg --attitudefile ...
Note that you still need to set the source region, but since an attitude file is already given the call to aeattcor2 will be skipped and the events are corrected using the given file instead.
Finally, you may delete the prepdir directory of the --sloppygti preparation (and only that).
Source and Background Regions
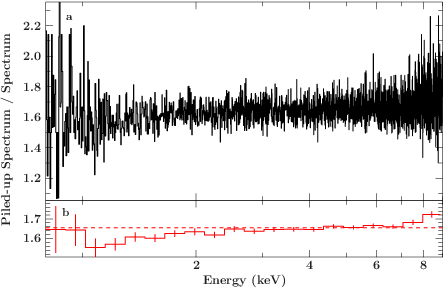
Creating a source region for each XIS and read-out mode is more complicated due to pile-up. If two photons hit a pixel of the CCD at the same frame, they cannot be distinguished. During the read-out they look like a single photon with the sum of theire energies. Thus, a piled-up spectrum appears to be harder and flux in the soft energy range (< 5 keV) is missing (compare Figure on the right).
To handle pile-up correctly, one has to estimate the probability for pile-up (the pile-up fraction) in each pixel for each XIS and mode. The resulting pile-up maps (of the source) are then used to create the extraction regions.
The pile-up estimation is done by xisextract as well, which calls pileest internally. You can skip this call if you give the --nopileup option during the --full call to xisextract. That means as soon as you have extracted the full images of the XIS you've automatically got the pile-up maps. They are located in the reprocessed.att directory and are named ae{obsid}xiN_*_pileup.img There are pile-up maps for each XIS and mode, and you have to create source and background regions avoiding pile-up for all. Thus, the region filenames have to include the XIS and mode, of course.
Once you have opened a pile-up map with, e.g., DS9 the pixel value now represents the pile-up fraction instead of the number of counts. The easiest source region shape to take pile-up into account is an annulus with an outer radius of 90 arcsec. It's strongly recommended to use the same outer radius for all XIS and modes to get stable cross-calibration factors! The inner radius has to be determined such that within that radius the pile-up fraction is meanly below a certain value. Here, we suggest to skip regions with more than 4% pile-up.
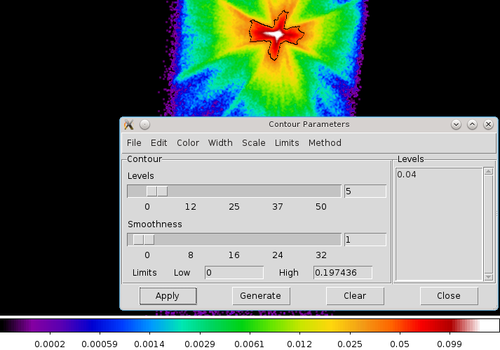
To speed up the determination of the inner radius, you can add the 4% (or whatever) contour to the image shown in DS9. Therefore, select the "Contour Parameters" item in the "Analysis" menue. In the new window, add the 0.04 level to the list on the right, delete all other levels, and set the smoothness to zero. After a click on "Apply" a contour will be drawn representing 4% pile-up fraction (see the black line in the example on the left). Now, it is easier to create the source region (see the example below).
For the background regions no pile-up has to be considered (hopefully), such that their shape may be simple circles. Just move them to the borders of the chip or to another area outside of all sources.
Save both, the source and background regions, as separate files. For example, xis3_3x3_src.reg and xis3_3x3_bkg.reg, respectively.
Extracting spectra and lightcurves
Once you have created source and background regions for each XIS and mode, the extraction of spectra and lightcurves are just calls to xisextract:
xisextract --prepdir ... --name name_of_subdirectory --xis=N --mode MxM --srcreg src_region_file --bkgreg bkg_region_file --attitude
Here, the --name specifies the subdirectoy to be created in the prepdir directory. In there, there will be additional directories created for each XIS, named xisN (N=0-3). Because there is a source and background region for each XIS and mode you have to specify those as well. The --attitude option tell xisextract to use the attitude corrected eventfiles as available in the reprocessed.att directory.
By default, xisextract creates spectra and lightcurves. Since the ARF for each XIS has to be simulated (which may take some time), you may skip the ARF-generation or the spectrum extraction by providing --noarf or --nospe, respectively. If you add the --nolc option no lightcurve is extracted as well. The time resolution of the lightcurve can be set with the --dt option (the default is 100 s). The smallest time resolution is determined by the read-out mode. See the xisextract help for details and more options.
Adding Modi
After having extracted the data, there will be spectra for each XIS and mode. You should __not__ add the spectra of the individual XIS (due to different responses). Instead, analyse the spectra simultaneously. But you may add the spectra of the available modi for each XIS, resulting in one single spectra per XIS. You can achieve that using the phaadd command:
phaadd --nousegti --backscaltol=0.1 /full_path_to_new_merged_spectrum_basename /full_path_to_xisN_mode1.pha /full_path_to_xisN_mode2.pha
You have to skip the creation of a single GTI file and in most cases you have to specify the tolerance of the background scaling factor as well.
PIN and GSO
Unlike the XISx the PIN and GSO have no imaging capabilities. Thus, creating the source and background regions is not possible, which simplifies the extraction. One of the disadvantages is, however, that the __background is not measurable__ during an observation! Like for the PCA on RXTE, the non X-ray background (NXB ) as caused by the detector itself is simulated instead. For PIN, there are [different versions] available: the //tuned// (the default in the //hxdextract// extraction script, see below) and quick simulated backgrounds. There are multiple NX background versions for GSO available as well (the default is 2.6 currently). Furthermore, a so-called cosmic X-ray background (CXB) is added to the simulated PIN background, based on a model by [(:biblio:Boldt84a)]. For HXD the CXB is assumed to be negligible.
Since the instrumental settings of PIN changed in the past and might still be changed, we have to select the corresppnding PIN response epoch matching our observation of interest. The current ARF version 20120526 of the GSO was calibrated on the crab pulsar. Fortunately, the hxdextract already uses this ARF and it calls hxdpinxbpi with the CALDB option, such that the correct PIN response for a particular observation is used as well.
All in all, to extract the HXD-spectra and -lightcurves including the correct backgrounds and responses, simply call
hxdextract --prepdir ... --name name_of_subdirectory --all
Like for xisextract, this will create the subdirectoy specified by --name within the prepdir directory. Furthermore, there will be subdirectories for the PIN and GSO data. Instead of extracting data from both instruments as indicated by the --all option you can specify those detectors separately.
Note: the file of the PIN and GSO spectra are named ae_hxd_pin_sr.pi and ae_hxd_gso_sr.pi, respectively. The spectra are consistent, however, with PHAII files.
To include the PIN response epoch in your paper, just look into the header of the PIN spectrum. For instance if hxdextract was called with --name=spectrum try
fkeyprint spectrum/pin/ae_hxd_pin_sr.pi RESPFILE
This might results in "ae_hxd_pinxinome11_20110601.rsp", thus its epoch 11 (e11) introduced in 2011/06/01. Please note that the response file also depends on the pointing of the satellite, which can be either the XIS- (xinom) or PIN nominal position (pinnom). These two different pointings are also available for the GSO response file.
Data Reduction Section
Besides the used energy ranges and signal-to-noise ratio or channel grouping, you should consider to explain the following points in the data reduction section of your paper (adopted and translated from an email by Katja Pottschmidt):
"To mention the used background versions..." (concerning PIN and GSO) "... sounds reasonable. Furthermore, it's typical to mention the shape and size of the XIS regions. Have you applied the attitude correction? What are the criteria for pile-up reduction? Is the PIN spectrum corrected for CXB (should be done by the scripts automatically)? Which PIN response did you use and which CALDB versions for the XRT (=the XIS mirrors), XIS, and HXD?"
