Plot data with gaps (xfig example)
Jump to navigation
Jump to search
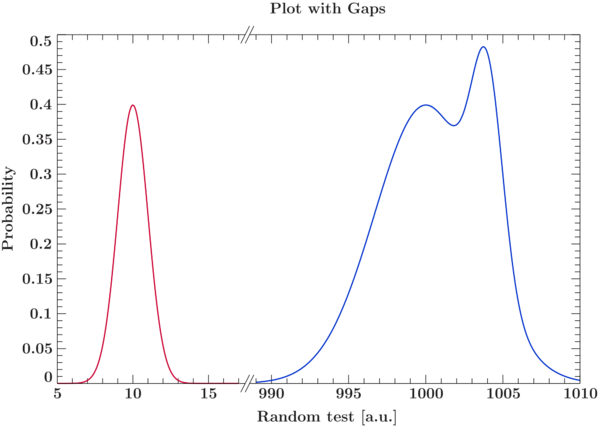
Plot data over range with gaps

%% Found yourself with data that is only interesting in some parts of the
%% plot range? Ever wondered how you can do this with XFig? Here is your chance!
%%
%% The idea: Give the ranges of interest and the data to plot. Arrange the data
%% in subplots and add a visible marker to make the seperation clear.

require("xfig");

% Some function do demonstrate the feature
define zp (x) { return 1./sqrt(2*PI)*exp(-x*x/2.); }

%%%%%%%%%%%%%%%%%%%%%%%%%%%%%%%%%%%%%%%%%%%%%%%%%%%%
%  Here is where the plotting begins              %%

%-----------------------
%  Do a plot where the x-axis has a gap

variable x = [-20:20:0.001]; % The x-grid for the full function
variable y1 = zp(x); % Use the function, we shift it later when plotting
variable y2 = zp(.3*x)+.7*zp(x-4);

%% In xranges and yranges the plot range of interest are given. Make sure
%% they do not overlap (or the scale would be messed up).

% Environment setup
variable xranges = [{5,17},{989,1010}]; % Min and Max values for the subplots
variable yranges = [{0,.5}];
variable xlabel = "Random test [a.u.]";
variable ylabel = "Probability";
variable title = "Plot with Gaps";

%% NSUBn is the number of subplots. In XDIM, YDIM the size of the total plot
%% can be set.

variable NSUBX = length(xranges); % Number of x splittings
variable NSUBY = length(yranges); % Number of y splittings
variable XDIM = 15.; % Plots total x width
variable YDIM = 10.; % Plots total y width

%% Set some variables we use to store different stuff. xsepsize, ysepsize
%% determines how large the visible seperator should be. 0.5 is twice the
%% default major tic mark length, which seems to be a good value.

% Define the plot variables
variable P = {}; % collector for plot structures
variable i,j;
variable dx=0.,dy=0.; % Shift pannels
variable ddx, ddy; % Data of plot
variable xsepsize = 0.5; % Seperator size in x
variable ysepsize = 0.5; % Seperator size in y
variable XSEP1,XSEP2; % x seperator
variable YSEP1,YSEP2; % y seperator

%% Calculate the total x- and yrange we are covering. We need this to
%% set the plot panel size matching the relative range size.

variable sumxrange = 0.; % Total covered ranges for scaling
variable sumyrange = 0.;

foreach i (xranges) { sumxrange += _max(i[0], i[1])-_min(i[0],i[1]); }
foreach j (yranges) { sumyrange += _max(j[0], j[1])-_min(j[0],j[1]); }

%% Some more variable we need to set the spacing between panels right.

variable thisxmin, thisxmax; % Current panels min and max range
variable thisymin, thisymax;

variable xspace = 0.; % Extra space so the total size is reached
variable yspace = 0.;

%% Loop over all ranges and create a panel for each. Remove the tics in
%%  between and insert the visible seperator. Finally plot the data and
%%  adjust the panels.

_for j (0, NSUBY-1, 1)
{
  thisymin = _min(yranges[j][0], yranges[j][1]);
  thisymax = _max(yranges[j][0], yranges[j][1]);
  dx = 0.;

  % Set extra y space as necessary
  if (NSUBY > 1) {
    if (j > 0 && j < NSUBY-1)
      yspace = ysepsize;
    else
      yspace = ysepsize/2.;
  }

  _for i (0, NSUBX-1, 1) {
    thisxmin = _min(xranges[i][0], xranges[i][1]);
    thisxmax = _max(xranges[i][0], xranges[i][1]);

    % Set extra x space as necessary
    if (NSUBX > 1) {
      if (i > 0 && i < NSUBX-1)
	xspace = xsepsize;
      else
	xspace = xsepsize/2.;
    }

    % Create plot object for each section
    list_append(P, xfig_plot_new(XDIM*(thisxmax-thisxmin)/sumxrange-xspace,
			         YDIM*(thisymax-thisymin)/sumyrange-yspace));

    % Set world according to given ranges
    P[-1].world(xranges[i][0], xranges[i][1], yranges[j][0], yranges[j][1]);

    % Set axis to confine plot labels so they do not overlap
    %P[-1].axis(; ticlabels_confine);

    % Start with top left panel and go right to bottom to remove tic marks
    variable this = P[-1].plot_data;
    if (j > 0) % All panels that are not the first one (y) do not need x2axis tics
      P[-1].x2axis(;off);
    if (i > 0) % All panels not the first (x) do not need y1axis tics
      P[-1].y1axis(;off);
    if (j < NSUBY-1) % All panels not the last (y) do not need x1axis tics
      P[-1].x1axis(;off);
    if (i < NSUBX-1) % All panels not the last (x) do not need y2axis tics
      P[-1].y2axis(;off);

    % Plot into panels
    P[-1].plot(x+10, y1; color="#CC0033");
    P[-1].plot(x+1000, y2; color="#0033CC");

    % Create plot objects for seperators (unfortunately the implementation does not
    % allow to reuse objects)
    XSEP1 = xfig_plot_new(1,1); XSEP2 = xfig_plot_new(1,1);
    XSEP1.world(-1,1,-1,1); XSEP2.world(-1,1,-1,1);
    XSEP1.axis(;off); XSEP2.axis(;off);
    XSEP1.plot([-1,-.25], [0,0]; width=1); XSEP2.plot([-1,-.25], [0,0]; width=1);
    XSEP1.plot([.25,1], [0,0]; width=1); XSEP2.plot([.25,1], [0,0]; width=1);
    XSEP1.plot([-.75,.25], [-1,1]; width=1); XSEP2.plot([-.75,.25], [-1,1]; width=1);
    XSEP1.plot([-.25,.75], [-1,1]; width=1); XSEP2.plot([-.25,.75], [-1,1]; width=1);
    XSEP1.axis(;off); XSEP2.axis(;off);
    XSEP1.scale(xsepsize); XSEP2.scale(xsepsize);

    YSEP1 = xfig_plot_new(1,1); YSEP2 = xfig_plot_new(1,1);
    YSEP1.world(-1,1,-1,1); YSEP2.world(-1,1,-1,1);
    YSEP1.axis(;off); YSEP2.axis(;off);
    YSEP1.plot([0,0],[-1,-.25]; width=1); YSEP2.plot([0,0],[-1,-.25]; width=1);
    YSEP1.plot([0,0], [.25,1]; width=1); YSEP2.plot([0,0], [.25,1]; width=1);
    YSEP1.plot([-1,1], [-.75,.25]; width=1); YSEP2.plot([-1,1], [-.75,.25]; width=1);
    YSEP1.plot([-1,1], [-.25,.75]; width=1); YSEP2.plot([-1,1], [-.25,.75]; width=1);
    YSEP1.scale(ysepsize); YSEP2.scale(ysepsize);

    % Append seperators
    if (i != NSUBX-1) {
      if (j == NSUBY-1)
	P[-1].add_object(XSEP1, 1,0,-.5,0; world0);
      if (j == 0)
	P[-1].add_object(XSEP2, 1,1,-.5,0; world0);
    }
    if (j != NSUBY-1) {
      if (i == NSUBX-1)
	P[-1].add_object(YSEP1, 0,0,0,.5; world0);
      if (i == 0)
	P[-1].add_object(YSEP2, 1,0,0,.5; world0);
    }

    % Shift pannel to negative y values
    if (i == 0) dy -= P[-1].plot_data.plot_height+ysepsize;
    ddx = P[-1].plot_data.X;
    P[-1].translate(vector(dx-ddx.x, dy-ddx.y, -ddx.z));
    dx += P[-1].plot_data.plot_width+xsepsize;
  }
}

%% Combine all the panels into one compound. We reverse the list to
%% keep the order from left-right top-bottom

list_reverse(P); % need to reverse to get the order right
variable PP = xfig_new_compound( __push_list(P)); % Combine panels
dy *= -1; % Set origin back to bottom left
PP.translate(vector(0, dy, 0));

variable xmin, xmax, ymin, ymax;
(xmin,xmax,ymin,ymax,,) = PP.get_bbox(); % Get total plot dimensions

%% When everything is set, add x- and y-labels and the title.

variable ptxt;
if (NSUBX == 1) % If only one use existing label
  P[0].xlabel(xlabel); % Only passed by reference, so we can change label here
else {
  ptxt = xfig_new_text(xlabel);
  xfig_justify_object(ptxt, vector(.5*dx, ymin, 0), vector(0, 1, 0));
  PP.append(ptxt);
}
if (NSUBY == 1)
  P[-1].ylabel(ylabel); % Same as for xlabel
else {
  ptxt = xfig_new_text(ylabel);
  ptxt.rotate_pict(90);
  xfig_justify_object(ptxt, vector(xmin, .5*dy, 0), vector(1, 0, 0));
  PP.append(ptxt);
}

% Set title
(xmin,xmax,ymin,ymax,,) = PP.get_bbox(); % Update dimensions
if (NSUBX == 1)
  P[-1].title(title);
else {
  ptxt = xfig_new_text(title);
  xfig_justify_object(ptxt, vector(.5*dx, ymax, 0), vector(0, -1, 0));
  PP.append(ptxt);
}

%% Here you go! Output the plot and enjoy it!
%%
%% One cautious note: as with xfig_multiplot it may happen that tic labels
%% are overlapping. To circumvent this either give major tic marks or change
%% the plotting ranges.

PP.render("plot_with_gaps.pdf");

<\pre>