4U 1907+09
- persistent High Mass X-ray Binary
- discovered by the Uhuru survey in 1971 ([1])
- famous source with a long spin-down, torque reversal to spin-up in 2003, and a another torque reversal back to spin-down in 2007.
- investigated a lot with INTEGRAL and RXTE, a little with Suzaku ([2]). XMM data exist but are not published.
- CRSF at 18 and 38keV found in BeppoSAX, fundamental line confirmed with Suzaku, but for 1. harmonic S/N too low.
- Coordinates : RA 19h 09' 37.9" , DEC +09° 49' 49"
- Magnetic field strength: ~2.1x10¹² G ([3])
Orbit
Orbital period* : 8.3753(1) days
Eccentricity* : 0.28(4)
Orbital epoch* : 50134.76(6) MJD
Longitude of periastron* : 330(7)°
Projected semimajor axis length* : 83(2) lt-s
* From ([4])
Companion
Typ* : O8–O9 Ia supergiant (Teff = 30500 K, R = 26 Rsun, L = 5x10⁵ Lsun, D > 5 kpc)
Mass loss rate (stellar wind)* : 7x10⁻⁶ Msun yr-1
* From ([5])
Accretion
- wind driven accretion (close orbit, high mass loss of the companion)
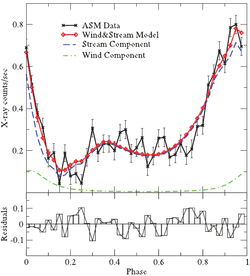
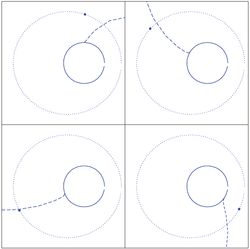
- wind & stream accretion (suggested by ([6])), explaining the double peaked lightcurve (see plot below):
 Plot left shows the double peaked light curve folded onto the orbital period and a zero phase at periastron based on data from the RXTE All-Sky Monitor.
Plot right shows the binary geometry including the mid-line of the stream (dashed line) and neutron star (filled circle) on its orbit (dotted line) around the companion star (open circle) at four orbital phases: 0.15 (top-left), 0.35 (top-right), 0.6 (bottom-left) and 0.95 (bottom-right)
Pulsation
Pulse profile :
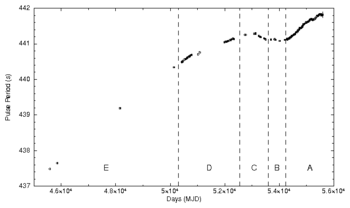
- Pulse period = ~441 s with long periods of constant Pdot interrupted by sudden torque reversals.
 Plot ([7]) shows the pulse period history.
Section E & D: Pdot = +0.230 s yr-1 dropping to Pdot = +0.115 s yr-1 in the end
Section C: Pdot = -0.158 s yr-1 (after torque reversal)
Section A: Pdot = 0.226 s yr-1
References
- ↑ Giacconi, R., Kellogg, E., Gorenstein, P., Gursky, H., Tananbaum, H., 1971, ApJL, 165, L27 (NASA ADS)
- ↑ Rivers, E., Markowitz, A., Pottschmidt, K., et al., 2010, ApJ 709, 179 (NASA ADS)
- ↑ Cusumano, G., di Salvo, T., Burderi, L., 1998, A&A, 338, L79 (NASA ADS)
- ↑ in 't Zand, J. J. M., Baykal, A., Strohmayer, T. E., 1998, ApJ, 496, 386 (NASA ADS)
- ↑ Fritz, S., Kreykenbohm, I., Wilms, J., et al., 2006, aap, 458, 885 (NASA ADS)
- ↑ Kostka, M., Leahy, D. A., 2010, mnras, 407, 1182 (NASA ADS)
- ↑ Sahiner, S., Inam, S.~C., Baykal, A., 2011, arXiv:1106.5957 (NASA ADS)
