Difference between revisions of "Polar plot (xfig example)"
Jump to navigation
Jump to search
m (Niu moved page Polar plot to Example: Polar plot) |
|
(No difference)
| |
Revision as of 16:31, 13 April 2018
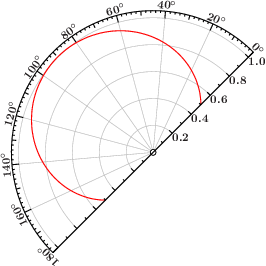
Polar plot with 'xfig_polarplot_new'

   % Plot coordinate transformation
   variable min = 0,
            max = 180,
            dir = 1,
            org = 45;
   variable ang = [min:max:#100];
   variable rad = 0.5+0.5*sin(ang*PI/180);
   variable xf = xfig_polarplot_new(; min=min, max=max, origin=org, dir=dir, grid );
   xf.plot( rad*cos( dir*(ang+org)*PI/180 ),
            rad*sin( dir*(ang+org)*PI/180 ) ; color="red" );
   xf.render("/tmp/test.pdf");