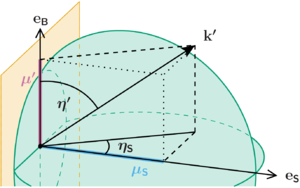
Object3dsimple (xfig example)
Jump to navigation
Jump to search
Polar plot with 'xfig_polarplot_new
require("isisscripts");
%%%%% GLOBAL PARAMETER: =======================================================

xfig_set_latex_preamble("\renewcommand{\vec}[1]{\ensuremath{\mathbf{#1}}}"R);

%%% CAMERA: modified Spherical angles
variable cam1 =  20*PI/180.; % cam1 = PI/2 -  thetaa
variable cam2 = -20*PI/180.; % cam2 = PI - phi


%%% GEOMETRY:
variable theta =  60*PI/180.; % Spot position
variable phi   = 35*PI/180.; % Spot position
variable R  = 1;


%%% PLOT DIMENSION
variable size = 18;
variable xmin = -0.50*R;
variable xmax =  2.20*R;
variable ymin = -0.175*R;
variable ymax =  2.10*R;

%%% PLOT COLORS
variable col_cbg = ["#88CCEE",
                    "#999933",
                    "#AA4499",
                    "#332288"
                   ];
variable emitter = CB_COLOR_SCHEME[3];
variable intens  = CB_COLOR_SCHEME[4];
variable mu      = CB_COLOR_SCHEME[5];
variable muS     = CB_COLOR_SCHEME[6];

%%% PHYSICAL VECTORS ==========================================================

%%% CAMERA: Basis vectors
variable c1 = vector(1,0,0);
variable c2 = vector(0,1,0);
variable c3 = vector(0,0,1);

c1 = vector_rotate( c1, vector(0,0,1), cam2 );
c2 = vector_rotate( c2, vector(0,0,1), cam2 );
c3 = vector_rotate( c3, vector(0,0,1), cam2 );
c1 = vector_rotate( c1, vector(1,0,0), cam1 );
c2 = vector_rotate( c2, vector(1,0,0), cam1 );
c3 = vector_rotate( c3, vector(1,0,0), cam1 );

%%% AXIS
variable ex = vector( R, 0, 0 );
variable ey = vector( 0, R, 0 );
variable ez = vector( 0, 0, R );

%%% PHOTON
variable k0  = vector( (1+2*sin(theta)*cos(phi))/3., phi, theta ; sph );
variable k0xy= @k0; k0xy.z=0;
variable k0x= @k0; k0x.y=0;k0x.z=0;
variable k0z= @k0; k0z.x=0;k0z.y=0;


%%% FUNCTIONS =================================================================
%%% Must be defined here, as functions require some global variables!

% Projection of vectors onto the camera plane
define P( v ){ %{{{
  variable vec = @v;
  if( typeof(vec)== Array_Type ){
    vec = merge_struct_arrays( v );
  }
  variable pro = vector_change_basis( vec, c1, c2, c3 );
  return pro;
}
%}}}
% Return x,z component of Projection
define PP( v ){ %{{{
  variable p = P(v);
  return p.x, p.z;
}
%}}}
% GREAT CIRCLE between 2 Vector
define GC( a, b ){ %{{{

  variable N = qualifier("N",100);
  variable R = qualifier_exists("R")? 1:0;

  variable na = unit_vector(a);
  variable nb = unit_vector(b);

  variable rotangle = [0:acos(dotprod(na,nb))-R*2*PI:#N];
  variable rotvec   = unit_vector( crossprod( a, b ) );

  variable gc = vector_rotate( na, rotvec, rotangle );

  return gc;
}
%}}}


%%% PREPARE PLOT ==============================================================
variable s = 1.1;
variable ls= s*1.06;
variable N = 50;

% arrow head
variable ARROW = xfig_create_arrow(;arrow_type=2,
                                   arrow_style=1,
                                   arrow_width=8,
                                   arrow_heigth=64,
                                   arrow_thickness=2
                                  );
variable AXIS = @ARROW;
AXIS.arrow_style=0;
AXIS.arrow_type=0;

% intensity profile
variable xyint1 = vector( [0,(1+2*cos([-PI/2:    0:#N]))/3.], [0,[-PI/2:    0:#N]], [0,[PI/2.:PI/2.:#N]]; sph );
variable xyint2 = vector( [(1+2*cos([    0: PI/2:#N]))/3.,0], [[    0: PI/2:#N],0], [[PI/2.:PI/2.:#N],0]; sph );
variable xzint1 = vector( [0,(1+2*sin([    0: PI/2:#N]))/3.], [0,[    0:    0:#N]], [0,[0    : PI/2:#N]]; sph );
variable xzint2 = vector( [(1+2*sin([ PI/2:   PI:#N]))/3.,0], [[    0:    0:#N],0], [[PI/2 :   PI:#N],0]; sph );
variable yzint = vector( (1+2*cos([-PI/2:-PI/2:#N]))/3., [-PI/2:-PI/2:#N], [0    :2.*PI:#N]; sph );

% mu: eta angle
variable eta  = .3*GC( k0, k0z );
variable etaS = .3*GC( k0x, k0xy );

%%% PLOT ======================================================================
variable xp = xfig_plot_new(size,(ymax-ymin)/(xmax-xmin)*size);
xp.world( xmin, xmax, ymin, ymax ; padx=0.0, pady=0.0 );
xp.axis(;off);

% axis
xp.plot( PP([0,s]*R*ex); forward_arrow=AXIS );
xp.xylabel( PP(ls*R*ex), "$\vec{e}_\mathsf{S}$"R  );

% xp.plot( PP([0,s]*R*ey); forward_arrow=AXIS );
% xp.xylabel( PP(ls*ey), "$y$"R  );

xp.plot( PP(.5*[0,s]*ez); forward_arrow=AXIS  );
xp.xylabel( PP(.5*ls*ez), "$\vec{e}_\mathsf{B}$"R  );

% ZERO
xp.plot( PP(0.01*yzint) ; width=4, depth=10 );

% k0
xp.plot( PP([0,1]*k0); width=2, forward_arrow=ARROW );
xp.xylabel( PP(1.1*k0), "$\vec{k}'$"R  );

% k0 components
xp.plot( PP([0,1]*k0xy); width=2 );

xp.plot( PP([k0z,k0])  ; width=2, line=1 );
xp.plot( PP([k0xy,k0]) ; width=2, line=1 );
xp.plot( PP([k0xy,k0x]); width=2, line=1 );
xp.plot( PP([k0z,k0z+k0x]); width=2, line=2 );
xp.plot( PP([k0x,k0z+k0x]); width=2, line=2 );
xp.plot( PP([k0,k0z+k0x]); width=2, line=2 );

% angles
xp.plot( PP(eta)  ; width=2, line=0 );
xp.xylabel( PP(0.75*vector(mean(eta.x),mean(eta.y),mean(eta.z))), "$\eta'$"R  );
xp.plot( PP(etaS) ; width=2, line=0 );
xp.xylabel( PP(1.25*vector(mean(etaS.x),mean(etaS.y),mean(etaS.z))), "$\eta_\mathsf{S}$"R  );

% mus
xp.plot( PP([0,1]*k0x) ; width=4, color=muS );
xp.xylabel( PP(.9*k0x-.15*ey), "$\mu_\mathsf{S}$"R ; color=muS );
xp.plot( PP([0,1]*k0z) ; width=4, color=mu );
xp.xylabel( PP(.9*k0z-.15*ey), "$\mu'$"R ; color=mu );


% intensity
xp.plot( PP(xyint1) ; color=intens, line=0, width=2, depth=201 );
xp.plot( PP(xyint2) ; color=intens, line=0, width=2, depth=203 );
xp.plot( PP(xyint2) ; color=intens, line=1, width=1, depth=200 );

xp.plot( PP(xzint1) ; color=intens, line=0, width=2, depth=201 );
xp.plot( PP(xzint2) ; color=intens, line=0, width=2, depth=202 );
xp.plot( PP(xzint2) ; color=intens, line=1, width=1, depth=200 );

xp.plot( PP(yzint)  ; color=intens, line=0, width=2, depth=204 );
xp.plot( PP(yzint)  ; color=intens, line=1, width=1, depth=200 );

xp.shade_region( PP(xyint1) ; color=intens, fill=36, width=0, depth=201 );
xp.shade_region( PP(xyint2) ; color=intens, fill=36, width=0, depth=203 );
xp.shade_region( PP(xzint1) ; color=intens, fill=36, width=0, depth=201 );
xp.shade_region( PP(xzint2) ; color=intens, fill=36, width=0, depth=202 );
xp.shade_region( PP(yzint)  ; color=intens, fill=36, width=0, depth=204 );


% emitter plane
variable eplane = .5*R*vector( [ [ 0: 0:#N], [ 0: 0:#N],[ 0: 0:#N],[ 0: 0:#N]],
                               [ [-1: 1:#N], [ 1: 1:#N],[ 1:-1:#N],[-1:-1:#N]],
                               [ [-1:-1:#N], [-1: 1:#N],[ 1: 1:#N],[ 1:-1:#N]]
                             );
xp.shade_region( PP(eplane); color=emitter, fill=36,depth=250, width=0 );
xp.plot( PP(eplane); color=emitter, line=0, depth=205, width=1 );
xp.plot( PP(eplane); color=emitter, line=1, depth=200, width=1 );


xp.render("bdsframe.pdf");
