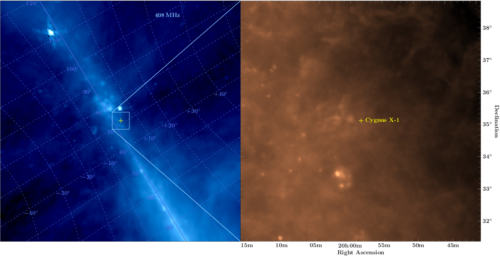
Satellite Picture Zoom (xfig example)
Jump to navigation
Jump to search
require("isisscripts");
require("wcsfuns");

%variable datapath="../";
variable datapath="/home/boeck/work/cygX1/images/";
variable height = 18;

variable box_col = "#88CCFF";

variable cygX1_lon = 299.590333 ;
variable cygX1_lat =  35.201611 ;

%%%%%%%%%% user defined color scheme
variable R,G,B;
R=nint ([Integer_Type[125],[0:255:#130]]);
G=nint ([[0:0:#55],[0:255:#150],[255:255:#50]]);
B=nint ([[0:255:#155], ones(100)*255]);
png_add_colormap("blue",(R*0x10000+G*0x100+B));
%%%%%%%%%%%%%%%%%%%%%%%%%%%%%%%%%%%%%

variable img = fits_read_img (datapath+"CygX1-HI_0408MHz.fits");
variable wcs = fitswcs_get_img_wcs (datapath+"CygX1-HI_0408MHz.fits");

img = log(img-0.8*min(img));

variable size = array_shape(img);
variable x = size[1];
variable y = size[0];

variable ph = height;
variable pw = ph*x/double(y);

variable p = xfig_plot_new (pw,ph);
variable p_xmin = -0.5;
variable p_xmax = x+0.5;
variable p_ymin = -0.5;
variable p_ymax = y+0.5;
p.world(p_xmin,p_xmax,p_ymin,p_ymax);
p.plot_png (img; cmap = "blue", depth = 100);
p.axis(;off);

%%%%%%%%%%%%%% plot source
variable clr = "yellow";
variable pos_y,pos_x;
(pos_y,pos_x) = wcsfuns_project (wcs, cygX1_lon, cygX1_lat);
p.plot(pos_x,pos_y; sym="+", color=clr,depth=80);

%%%%%%%%%%%%%% plot grid
variable gridclr = "#4466DD";

variable l_axis = [120:20:#200];
variable b_axis = [-50:60:#200];

variable ra,dec;
(ra,dec) = RAdec_from_galLB (l_axis,0);
(pos_y,pos_x) = wcsfuns_project (wcs, ra,dec);
p.plot(pos_x,pos_y; width=2,color=gridclr,depth=84);

%%%% l=0 axis is outside of plot range
% (ra,dec) = RAdec_from_galLB (0,b_axis);
% (pos_y,pos_x) = wcsfuns_project (wcs, ra,dec);
% p.plot(pos_x,pos_y; width=2,color=gridclr,depth=84);

variable v;
foreach v ([[-50:-10:10],[10:60:10]])
{
  (ra,dec) = RAdec_from_galLB (l_axis,v);
  (pos_y,pos_x) = wcsfuns_project (wcs, ra,dec);
  p.plot(pos_x,pos_y; width=1,line=1,color=gridclr,depth=90);
}
foreach v ([[20:120:10]])
{
  (ra,dec) = RAdec_from_galLB (v,b_axis);
  (pos_y,pos_x) = wcsfuns_project (wcs, ra,dec);
  p.plot(pos_x,pos_y;  width=1,line=1,color=gridclr,depth=90);
}

%%%%%%%%%%%%%% grid labels
foreach v ([[30:120:10]])
{
  (pos_y,pos_x) = wcsfuns_project (wcs, RAdec_from_galLB ( v, 0 ) );
  p.xylabel(pos_x,pos_y,sprintf("\$%d\^\\circ\$",v),0.4,1.1; color=gridclr,depth=87);
}
foreach v ([[10:40:10]])
{
  (pos_y,pos_x) = wcsfuns_project (wcs, RAdec_from_galLB ( 60, v ) );
  p.xylabel(pos_x,pos_y,sprintf("+\$%d\^\\circ\$",v),-0.1,0.8; color=gridclr,depth=87);
}
foreach v ([[-40:-10:10]])
{
  (pos_y,pos_x) = wcsfuns_project (wcs, RAdec_from_galLB ( 60, v ) );
  p.xylabel(pos_x,pos_y,sprintf("\$%d\^\\circ\$",v),-0.1,0.8; color=gridclr,depth=87);
}

p.xylabel(0.75,0.95,"408\\,MHz",0.5,0.5; color=box_col,world0,depth=70);

% p.render("HI_0408Mhz_large.pdf");


%%%%%%%%%%%%%%%%%%%%%%%%%%%%%%%%%%%%%%%%%
%%%%%%%% plot IRAS image

variable f = datapath+"CygX1-IRAS.fits";
variable wcs_iras = fitswcs_get_img_wcs(f);

variable img = fits_read_img(f);
variable x = length(img[0,*]);
variable y = length(img[*,0]);

% use some transformations/cuts/... to obtain a reasonable color scaling
img = log(img);

%%%%%%%%%%%%%%%%%%%%%%%%%%% determine wcs of coordinate axis
variable N = 500;
variable c0 = ones(N)*0.0;
variable x_arr = [0:x:#N];
variable y_arr = [0:y:#N];
variable x1ra , x1dec,  x2ra , x2dec, y1ra , y1dec,  y2ra , y2dec;
(x1ra , x1dec) = wcsfuns_deproject (wcs_iras, c0   , x_arr ); x1ra = pos_modulo(x1ra,360);
(x2ra , x2dec) = wcsfuns_deproject (wcs_iras, c0+y , x_arr ); x2ra = pos_modulo(x2ra,360);
(y1ra , y1dec) = wcsfuns_deproject (wcs_iras, y_arr, c0    ); y1ra = pos_modulo(y1ra,360);
(y2ra , y2dec) = wcsfuns_deproject (wcs_iras, y_arr, c0+x  ); y2ra = pos_modulo(y2ra,360);

%%%%%%%%%%%%%%%%%%%%%%%%%% determine ticmarks for x1axis
variable m =  15*(19 + [35:80:5]/60.0);
variable m5 = 15*(19 + [35:80:1]/60.0);
variable x1_ticlables = [35:80:5] mod 60;
variable x1_string_tic = array_map(String_Type, &sprintf, "%02dm" ,x1_ticlables);
variable index = where (x1_ticlables == 0);
x1_string_tic[index] = `20h\,`+x1_string_tic[index];
variable r = associate_arrays (m5, x1ra);
variable i_x1_h = r.index[where(r.index != 0 and r.index != N-1)];
r = associate_arrays (m5, x1ra);
variable i_x1_minor = r.index[where(r.index != 0 and r.index != N-1)];
r = associate_arrays (m, x1ra);
variable i_x1_major = where(r.index != 0 and r.index != N-1);
variable x1_major = x_arr[r.index[i_x1_major]];
x1_string_tic = x1_string_tic[i_x1_major];

%%%%%%%%%%%%%%%%%%%%%%%%%% determine ticmarks for x2axis
variable r = associate_arrays (m5, x2ra);
variable i_x2_h = r.index[where(r.index != 0 and r.index != N-1)];
r = associate_arrays (m5, x2ra);
variable i_x2_minor = r.index[where(r.index != 0 and r.index != N-1)];
r = associate_arrays (m, x2ra);
variable i_x2_major = where(r.index != 0 and r.index != N-1);
variable x2_major = x_arr[r.index[i_x2_major]];

%%%%%%%%%%%%%%%%%%%%%%%%%% determine x (ra) grid
variable x_grid = m[[i_x1_major,i_x2_major]]; x_grid = x_grid[unique(x_grid)];
variable x_ymin, x_ymax; (x_ymin, x_ymax) = min_max(x1dec,x2dec);

%%%%%%%%%%%%%%%%%%%%%%%%%% determine ticmarks for y1axis
variable d = [30:40];
variable d_10min = [30:40:#(10*6 + 1 )];
r = associate_arrays (d_10min, y1dec);
variable i_y1_minor = r.index[where(r.index != 0 and r.index != N-1)];
r = associate_arrays (d, y1dec);
variable i_y1_major = where(r.index != 0 and r.index != N-1);
variable y1_ticlables = d[i_y1_major];
variable y1_string_tic = array_map(String_Type, &sprintf, `%d$^{\circ}$`, d);
y1_string_tic = y1_string_tic[i_y1_major];
variable y1_major = y_arr[r.index[i_y1_major]];

%%%%%%%%%%%%%%%%%%%%%%%%%% determine ticmarks for y2axis
r = associate_arrays (d_10min, y2dec);
variable i_y2_minor = r.index[where(r.index != 0 and r.index != N-1)];
r = associate_arrays (d, y2dec);
variable i_y2_major = where(r.index != 0 and r.index != N-1);
variable y2_ticlables = d[i_y2_major];
variable y2_major = y_arr[r.index[i_y2_major]];

%%%%%%%%%%%%%%%%%%%%%%%%%% determine y (dec) grid
variable y_grid = d[[i_y1_major,i_y2_major]]; y_grid = y_grid[unique(y_grid)];
variable y_xmin, y_xmax; (y_xmin, y_xmax) = min_max(y1ra,y2ra);

variable axis_col = "gray";
variable grid_col = "gray";
variable pheight = height;
variable pwidth  = pheight/double(y)*x;

variable iras = xfig_plot_new(pwidth, pheight);
iras.world(0,x,0,y);
iras.axis(;color=axis_col);
iras.x1axis(; major = x1_major, minor = x_arr[i_x1_minor], ticlabels=x1_string_tic);%x1_ticlables);
iras.x2axis(; major = x2_major, minor = x_arr[i_x2_minor], ticlabels=0); %x2_ticlables);
iras.y2axis(; major = y1_major, minor = y_arr[i_y1_minor], ticlabels=y1_string_tic);%y1_ticlables);
iras.y1axis(; major = y2_major, minor = y_arr[i_y2_minor], ticlabels=0); %y2_ticlables);
iras.y2label("Declination");
iras.xlabel("Right Ascension");

iras.plot_png( img; cmap = "copper") ;

(pos_y,pos_x) = wcsfuns_project (wcs_iras, cygX1_lon, cygX1_lat);
iras.plot(pos_x,pos_y; sym="+", color=clr,depth=80);
iras.xylabel(pos_x,pos_y,"Cygnus X-1",-0.6,0; color=clr,depth=80);
iras.xylabel(0.95,0.95,"IRAS",0.5,0.5; color="orange2",world0,depth=70);

% shift image by the width of the first one for compound
iras.translate(vector(pwidth,0,0));
p.add_object(iras);

%%%%%%%% plot zoom-in box
variable box_x, box_y;
(box_y,box_x) = wcsfuns_project (wcs,
				 [ x1ra[[0,-1]], x2ra[[-1,0]], x1ra[0]],
				 [ x1dec[[0,-1]],x2dec[[-1,0]],x1dec[0] ]
				); % using only corners (if curved, project complete axes)
p.plot(box_x,box_y; color = box_col);
p.plot( [box_x[0],p_xmax], [box_y[0],p_ymin] ; color = box_col);
p.plot( [box_x[-2],p_xmax], [box_y[-2],p_ymax] ; color = box_col);

p.render("CygX1.pdf");
